Economic development within the Aurubis Group
Result of operations, net assets, and financial position
In order to portray the Aurubis Group’s operating success independently of measurement influences for internal management purposes, the presentation of the results of operations, net assets, and financial position in accordance with IFRS is supplemented by the results of operations and net assets explained on the basis of operating values.
With the signing of the term sheet on February 12, 2018, Segment Flat Rolled Products (FRP) fulfills the conditions to be recognized as discontinued operations in accordance with IFRS. On March 29, 2018, Aurubis AG and Wieland-Werke AG signed a contract to sell Segment Flat Rolled Products. The final execution of the sales contract is subject to approval by the antitrust authorities. A final decision is expected in early 2019.
In this respect, the presentation and measurement rules specified in IFRS 5 must be applied for Segment FRP in fiscal year 2017/18. These include, among other things, a separate, aggregated disclosure of consolidated net income from discontinued operations in the consolidated income statement, as well as a separate, aggregated disclosure of assets and liabilities held for sale for the discontinued operations in the consolidated statement of financial position. Furthermore, additional notes to the financial statements are necessary Acquisitions and discontinued operations, page 123. With respect to measurement in accordance with IFRS 5, among other things, any impact on income deriving from scheduled depreciation and amortization in Segment FRP, or from application of equity accounting for the purpose of consolidating the investment in the joint venture, Schwermetall Halbzeugwerk GmbH & Co. KG (Schwermetall), must be discontinued in the IFRS consolidated financial statements.
The Executive Board continues to treat Segment FRP as an operating reporting segment and, consequently, the financial reporting for operating purposes will remain unchanged until such time as the sales transaction is finalized.
As a result, the accounting impacts deriving from IFRS 5 in the financial statements are reversed in the reconciliation between IFRS reporting and operating reporting.
As regards the reconciliation of the consolidated income statement, the items reported as discontinued activities are again shown separately. For purposes of measurement, the impacts on income deriving from scheduled depreciation and amortization of fixed assets, or from application of equity accounting for the purpose of consolidating the investment are accounted for, as in the past. In order to demonstrate the Aurubis Group’s operating success, subsequent adjustments are also made to inventories and non-current assets.
In order to adjust the measurement impacts in inventories resulting from the application of IAS 2, metal price fluctuations resulting from the application of the average cost method are eliminated in the same manner as any write-downs or appreciation in value for copper inventories at the reporting date. Furthermore, from fiscal year 2010/11 onwards, fixed assets have been adjusted for effects deriving from purchase price allocations (PPAs), primarily relating to property, plant, and equipment.
As regards the reconciliation of the consolidated statement of financial position, assets and liabilities held for sale as discontinued operations are again disclosed in a disaggregated form and the measurement effects on the relevant items in the statement of financial position are recognized as they have been in the past. Subsequently, in order to demonstrate the Aurubis Group’s operating success, measurement impacts on inventories and fixed assets are also adjusted for.
The following table shows how the respective operating results for the 2017/18 fiscal year and for the comparative prior-year period have been determined.
Reconciliation of the consolidated income statement
Results of operations (operating)
Operating EBT in the fiscal year amounts to € 329 million and is derived from continuing and discontinued operations of the IFRS result before income taxes, as follows:
The Aurubis Group generated IFRS earnings before taxes of € 322 million from continuing operations in fiscal year 2017/18 (previous year: € 408 million). IFRS earnings before taxes from discontinued operations amount to € 46 million (previous year: € 48 million).
The accounting impacts of IFRS 5, which has been applied to Segment FRP since early March, were reversed to derive the operating result. Accordingly, scheduled depreciation and amortization (€ -8 million) and the recognition in income of the shares of Schwermetall consolidated using the equity method (€ 9 million) were taken into account in the reconciliation to the operating result, as in the past.
Moreover, to derive the operating result, the IFRS result was adjusted for inventory measurement effects of € -42 million (previous year: € -161 million) (the total of the following positions: “Changes in inventories of finished goods and work in process,” “Cost of materials,” and “Result from investments measured using the equity method”), as well as for impacts of € 3 million (previous year: € 3 million) deriving from allocations of the purchase price, resulting in operating earnings before taxes of € 329 million (previous year: € 298 million).
Operating EBT was positively influenced by:
- A higher concentrate throughput due to a good performance at the Hamburg and Pirdop sites. The previous year was negatively impacted by a scheduled maintenance shutdown in Hamburg in Q1 2016/17,
- Substantially higher refining charges for copper scrap with good availability,
- Higher sulfuric acid revenues due to considerably higher sales prices,
- A higher metal yield with increased copper prices,
- Significantly higher sales volumes for wire rod products,
- Higher sales volumes for flat rolled products, and
- Additional positive contributions from our efficiency improvement program.
The weaker US dollar had an opposite effect.
The Group’s revenues increased by € 654 million to € 11,694 million (previous year: € 11,040 million) during the reporting period. This development was primarily due to the higher average copper price.
Breakdown of revenues
| in % | 2017/18 | 2016/17 |
| Germany | 34 | 35 |
| European Union | 37 | 36 |
| Rest of Europe | 4 | 5 |
| Other countries | 25 | 24 |
| Total | 100 | 100 |
The inventory change amounted to € -8 million. The inventory change of € -65 million in the previous year was primarily caused by a reduction in copper inventories.
In a manner corresponding to the development for revenues and inventory changes, the cost of materials increased by € 674 million, from € 9,862 million in the previous year to € 10,536 million.
Own work capitalized increased by € 10 million in the fiscal year, to € 19 million (previous year: € 9 million). The increase is mainly due to activities related to the Future Complex Metallurgy project.
After taking other operating income into account, the residual gross profit was € 1,214 million (previous year: € 1,169 million).
Personnel expenses rose from € 470 million in the previous year to € 484 million due to wage tariff agreement increases and a slightly higher number of employees. During the reporting year, we particularly strengthened our personnel resources in order to address certain issues that will grow in importance in the future. These include areas such as research, development, innovation, technology, and the Future Complex Metallurgy project. Lower personnel costs at the Buffalo, USA, site – resulting from the exchange rate development – had an opposite effect.
At € 130 million, depreciation and amortization of fixed assets was slightly below the prior-year level (€ 132 million).
Other operating expenses were € 268 million compared to € 259 million in the previous year.
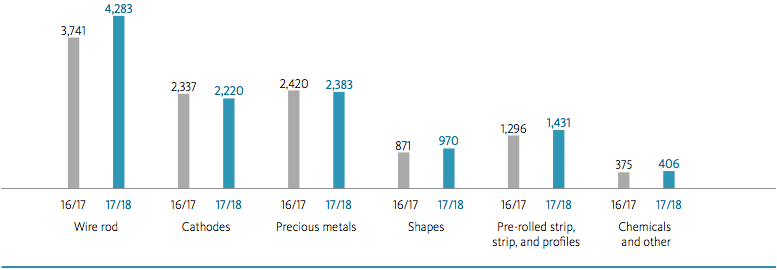
Development of revenues by products
in € million
The operational result before interest and taxes (EBIT) therefore amounted to € 332 million (previous year: € 308 million).
At € 15 million, net interest expense was below the prior-year level (€ 17 million). The decrease resulted from reduced gross debt in connection with the redemption of bonded loans (Schuldscheindarlehen).
After taking the financial result into account, operating earnings before taxes (EBT) were € 329 million (previous year: € 298 million).
Operating consolidated net income of € 265 million remained after tax (previous year: € 236 million). Operating earnings per share amounted to € 5.87 (previous year: € 5.21).
Result of operations (IFRS) from continuing operations
Due to the classification of Segment FRP as an operation intended for sale, the following values regarding the results of operations are exclusively related to continuing operations.
The Aurubis Group generated a consolidated net result of € 263 million in fiscal year 2017/18 (previous year: € 318 million).
Consolidated income statement
| in € million | 2017/18 IFRS |
2016/17 IFRS |
| Revenues | 10,424 | 9,880 |
| Changes in inventories/own work capitalized | 19 | -8 |
| Other operating income | 43 | 47 |
| Cost of materials | -9,464 | -8,826 |
| Gross profit | 1,022 | 1,093 |
| Personnel expenses | -352 | -338 |
| Depreciation of property, plant, and equipment and amortization of intangible assets | -119 | -121 |
| Other operating expenses | -217 | -210 |
| Operational result (EBIT) | 334 | 424 |
| Financial result | -12 | -16 |
| Earnings before taxes (EBT) | 322 | 408 |
| Income taxes | -59 | -90 |
| Consolidated net income | 263 | 318 |
The Group’s revenues increased by € 544 million to € 10,424 million (previous year: € 9,880 million) during the reporting period. This development was primarily due to the higher average copper price.
Own work capitalized increased by € 10 million in the fiscal year, to € 19 million (previous year: € 9 million). The increase is mainly due to activities related to the Future Complex Metallurgy project.
In a manner corresponding to the development for revenues and inventory changes, the cost of materials increased by € 638 million, from € 8,826 million in the previous year to € 9,464 million.
After taking other operating income into account, the residual gross profit was € 1,022 million (previous year: € 1,093 million).
In addition to the effects on earnings described in the explanation of the operating results of operations, the change in gross profit was also due to metal price developments. The use of the average cost method leads to metal price valuations that are close to market prices. Metal price volatility therefore has a direct effect on the change in inventories/cost of materials and thus on the IFRS gross profit. The depiction of this volatility in the IFRS gross profit is not relevant to the cash flow and does not reflect Aurubis’ operating performance.
Personnel expenses rose from € 338 million in the previous year to € 352 million due to wage tariff agreement increases and a slightly higher number of employees. During the reporting year, we particularly strengthened our personnel resources in order to address certain issues that will grow in importance in the future. These include areas such as research, development, innovation, technology, and the Future Complex Metallurgy project.
At € 119 million, depreciation and amortization of fixed assets was slightly below the prior-year level (€ 121 million).
Other operating expenses were € 217 million compared to € 210 million in the previous year.
Earnings before interest and taxes (EBIT) therefore amounted to € 334 million (previous year: € 424 million).
At € 13 million, net interest expense was below the prior-year level (€ 15 million). The decrease resulted from reduced gross debt in connection with the redemption of bonded loans (Schuldscheindarlehen).
After taking the financial result into account, earnings before taxes were € 322 million (previous year: € 408 million).
Consolidated net income of € 263 million from continuing operations remained after tax (previous year: € 318 million). Earnings per share from continuing operations amounted to € 5.81 (previous year: € 7.04).
Net assets (operating)
The table Reconciliation of the consolidated statement of financial position, page 72 shows the derivation of the operating statement of financial position as at September 30, 2018, and as at September 30, 2017.
Total assets increased from € 3,975 million as at September 30, 2017 to € 4,077 million as at September 30, 2018, primarily due to increased inventories.
The Group’s equity increased by € 174 million, from € 2,087 million as at the end of the last fiscal year to € 2,261 million as at September 30, 2018. This was largely due to the operating consolidated net income of € 265 million. The dividend payment of € 67 million and the impact on other comprehensive income deriving from the measurement of hedging transactions at market, amounting to € 27 million, had an opposite effect.
Overall, the operating equity ratio (the ratio of equity to total assets) was therefore 55.5 % compared to 52.5 % as at the end of the previous fiscal year.
Development of borrowings
At € 314 million as at September 30, 2018, borrowings were below the level of the previous fiscal year-end (€ 351 million). The primary reason for this was the redemption of bonded loans (Schuldscheindarlehen) in February 2018.
Reconciliation of the consolidated statement of financial position
| 9/30/2018 | 9/30/2017 | ||||||||
| Adjustment effects | Adjustment effects | ||||||||
| in € million | IFRS from continuing operations |
Discontinued operations |
Inventories | PPA | Operating | IFRS | Inventories | PPA | Operating |
| ASSETS | |||||||||
| Fixed assets | 1,354 | 174 | -13 | -32 | 1,483 | 1,489 | -11 | -34 | 1,444 |
| Deferred tax assets | 3 | 1 | 25 | 0 | 29 | 6 | 25 | 0 | 31 |
| Non-current receivables and other assets | 28 | 2 | 0 | 0 | 30 | 32 | 0 | 0 | 32 |
| Inventories | 1,681 | 274 | -406 | 0 | 1,549 | 1,752 | -366 | 0 | 1,386 |
| Current receivables and other assets | 385 | 122 | 0 | 0 | 507 | 511 | 0 | 0 | 511 |
| Cash and cash equivalents | 461 | 18 | 0 | 0 | 479 | 571 | 0 | 0 | 571 |
| Assets held for sale | 590 | -590 | 0 | 0 | 0 | 0 | 0 | 0 | 0 |
| Total assets | 4,502 | 1 | -394 | -32 | 4,077 | 4,361 | -352 | -34 | 3,975 |
| EQUITY AND LIABILITIES | |||||||||
| Equity | 2,566 | 1 | -281 | -25 | 2,261 | 2,366 | -254 | -25 | 2,087 |
| Deferred tax liabilities | 188 | 16 | -113 | -7 | 84 | 205 | -98 | -9 | 98 |
| Non-current provisions | 254 | 34 | 0 | 0 | 288 | 307 | 0 | 0 | 307 |
| Non-current liabilities | 281 | 1 | 0 | 0 | 282 | 344 | 0 | 0 | 344 |
| Current provisions | 34 | 8 | 0 | 0 | 42 | 39 | 0 | 0 | 39 |
| Current liabilities | 1,017 | 103 | 0 | 0 | 1,120 | 1,100 | 0 | 0 | 1,100 |
| Liabilities deriving from assets held for sale | 162 | -162 | 0 | 0 | 0 | 0 | 0 | 0 | 0 |
| Total equity and liabilities | 4,502 | 1 | -394 | -32 | 4,077 | 4,361 | -352 | -34 | 3,975 |
| Explanation of the presentation and the adjustment effects in Results of operations, net assets, and financial position. | |||||||||
Return on capital (operating)
The return on capital employed (ROCE) shows the return on the capital employed in the operating business or for an investment. It was determined taking the operating EBIT of the last 4 quarters into consideration.
Operating ROCE was 14.8 % due to higher capital employed, compared to 15.1 % in the comparative period.
Operating return on capital employed (ROCE)
| in € million | 9/30/2018 | 9/30/2017 |
| Fixed assets excl. financial assets and investments measured using the equity method | 1,406 | 1,375 |
| Inventories | 1,549 | 1,387 |
| Trade accounts receivable | 374 | 357 |
| Other receivables and assets | 191 | 216 |
| – Trade accounts payable | -904 | -905 |
| – Provisions and other liabilities | -371 | -388 |
| Capital employed as at the reporting date | 2,246 | 2,042 |
| Earnings before taxes (EBT) | 329 | 298 |
| Financial result | 3 | 10 |
| Earnings before interest and taxes (EBIT) | 332 | 308 |
| Return on capital employed (operating ROCE) | 14.8 % | 15.1 % |
Net assets (IFRS)
Due to the classification of Segment FRP as discontinued operations, the following values regarding net assets in the current year are mainly related to the continuing operations in the Group.
Total assets increased from € 4,361 million as at the end of the last fiscal year to € 4,502 million as at September 30, 2018, due in particular to higher inventories as at the balance sheet date.
Structure of the statement of financial position of the Group
| in % | 9/30/2018 | 9/30/2017 |
| Fixed assets | 30 | 34 |
| Inventories | 37 | 40 |
| Receivables, etc. | 10 | 13 |
| Assets held for sale | 13 | 0 |
| Cash and cash equivalents | 10 | 13 |
| 100 | 100 | |
| Equity | 57 | 54 |
| Provisions | 10 | 13 |
| Liabilities | 29 | 33 |
| Liabilities deriving from assets held for sale | 4 | 0 |
| 100 | 100 |
The Group’s equity increased by € 200 million, from € 2,366 million as at the end of the last fiscal year to € 2,566 million as at September 30, 2018. This was largely due to the consolidated net income of € 263 million from continuing operations and of € 29 million from discontinued operations. The dividend payment of € 67 million and the impact on other comprehensive income deriving from the measurement of hedging transactions at market, amounting to € 27 million, had an opposite effect.
Overall, the equity ratio was 57.0 % as at September 30, 2018, compared to 54.2 % as at the end of the previous fiscal year.
The following table shows the development of borrowings:
Development of borrowings
| in € million | 9/30/2018 | 9/30/2017 |
| Non-current bank borrowings | 248 | 317 |
| Non-current liabilities under finance leases | 33 | 23 |
| Non-current borrowings | 281 | 340 |
| Current bank borrowings | 30 | 8 |
| Current liabilities under finance leases | 3 | 3 |
| Current borrowings | 33 | 11 |
| Borrowings | 314 | 351 |
At € 314 million as at September 30, 2018, borrowings were below the level of the previous fiscal year-end (€ 351 million). The primary reason for this was the redemption of bonded loans (Schuldscheindarlehen) in February 2018.
Return on capital (IFRS)
The operating result is used for control purposes within the Group. Operating ROCE is explained under Return on capital.
Financial position of the Aurubis Group
The following comments include both continuing and discontinued operations.
The Group’s liquidity sourcing is secured through a combination of the Group’s cash flow, short-term and long-term borrowings, as well as lines of credit available from our banks. Existing credit facilities and lines of credit can be utilized to compensate for fluctuations in the cash flow development at any time. These fluctuations result from operating business in particular and primarily serve to finance net working capital.
The development of the Aurubis Group’s liquidity position is monitored regularly on a timely basis. Control and monitoring are carried out on the basis of defined key ratios. In the reporting year, we repaid two bonded loans (Schuldscheindarlehen) that were due.
The main key financial ratio for controlling debt is debt coverage, which calculates the ratio of net borrowings (borrowings less cash and cash equivalents) to earnings before interest, taxes, depreciation, and amortization (EBITDA) and shows the number of periods required to redeem the existing borrowings from the Group’s income – assuming an unchanged earnings situation.
The interest coverage ratio expresses how the net interest expense is covered by earnings before interest, taxes, depreciation, and amortization (EBITDA).
Our long-term objective is to achieve a well-balanced debt structure. In this context, we consider debt coverage < 3 and interest coverage > 5 to be well balanced.
We use the operating result for control purposes within the Group. Accordingly, the Group’s key operating financial ratios are presented as follows:
Operating Group financial ratios
| 9/30/2018 | 9/30/2017 | |
| Debt coverage = net borrowings/EBlTDA |
-0.4 | -0.5 |
| Interest coverage = EBITDA/net interest |
32.3 | 26.1 |
Additional control measures related to liquidity risks are outlined in the Risk and Opportunity Report in the Combined Management Report.
Analysis of liquidity and funding
The cash flow statement shows the cash flows within the Group. It highlights how funds are generated and used.
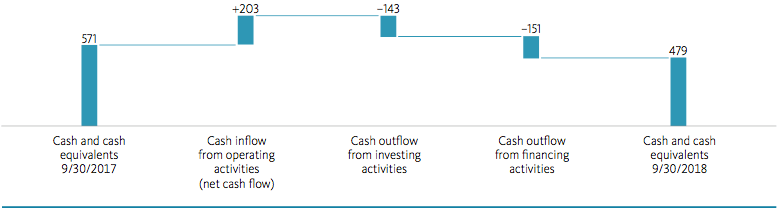
At € 203 million as at September 30, 2018, the net cash flow from operating activities was significantly below the prior-year level (€ 480 million). This was due in particular to higher inventories of precious metal-bearing raw materials as at the reporting date.
The cash outflow from investing activities totaled € 143 million (previous year: € 155 million). Investments in fixed assets in the fiscal year include payments for the industrial heat and Future Complex Metallurgy projects. The sale of investment property had a positive effect of about € 8 million on the cash flow from investment activities in the reporting period. The cash outflow in the previous year was influenced by a larger individual investment in connection with our long-term electricity supply agreement.
After deducting the cash outflow from investing activities of € 143 million from the net cash flow of € 203 million from operating activities, the free cash flow amounts to € 60 million (previous year: € 325 million).
The cash outflow from financing activities amounted to € 151 million (previous year: € 225 million) and primarily resulted – both in the fiscal year reported and in the previous year – from the redemption of bonded loans (Schuldscheindarlehen)
Cash and cash equivalents of € 479 million from continuing and discontinued operations were available to the Group as at September 30, 2018 (€ 571 million as at September 30, 2017). Cash and cash equivalents are utilized for operating business activities, investing activities, and the redemption of borrowings.
Source and application of funds
in € million
The net surplus financial funds amounted to € 165 million as at September 30, 2018 (previous year: € 220 million).
Net borrowings in the Group
| in € million | 9/30/2018 | 9/30/2017 |
| Borrowings | 314 | 351 |
| – Cash and cash equivalents | 479 | 571 |
| Net borrowings (minus = assets) | -165 | -220 |
In addition to cash and cash equivalents, the Aurubis Group has unutilized credit line facilities and thus has adequate liquidity reserves. Parallel to this, within the context of factoring agreements, the Group makes use of the sale of receivables without recourse as an off-balance-sheet financial instrument.