Aurubis Shares on the Capital Market
Stock markets influenced by uncertainties following a good start
The upward trend on the stock markets continued at the beginning of fiscal year 2017/18. The DAX reached a record high of 13,525 points in early November. However, a sharp increase in the euro rate due to strong economic data in the euro zone, as well as profit taking, thwarted the year-end rally. At the turn of the year, the DAX closed at 12,918 points but then hit a new all-time high of 13,596 points. The DAX wasn’t able to maintain this level for long, though. Rising interest rates in the US and a further increase in the euro rate, coupled with fears of negative economic impacts of a global trade conflict, led to restraint on the stock markets. On March 26, 2018, the DAX slipped to 11,787 points, the lowest level since February 2017. In the months thereafter, the international trade conflict in particular set the tone on the stock markets. A weakening euro rate and tailwinds from Wall Street pushed the DAX above the 13,000-point mark once more in May, however. At fiscal year-end, a sense of nervousness grew due not only to the lingering trade dispute but also to currency risks in certain emerging market countries and fears of a faster interest rate hike by the US Federal Reserve. At the start of September, the DAX once again fell below the 12,000-point mark, slightly recovering to 12,247 points at the close of September 28, 2018.
Aurubis share performance compared with the MDAX, DAX, and STOXX Europe 600 from October 1, 2017 to September 30, 2017
indexed to 100 %
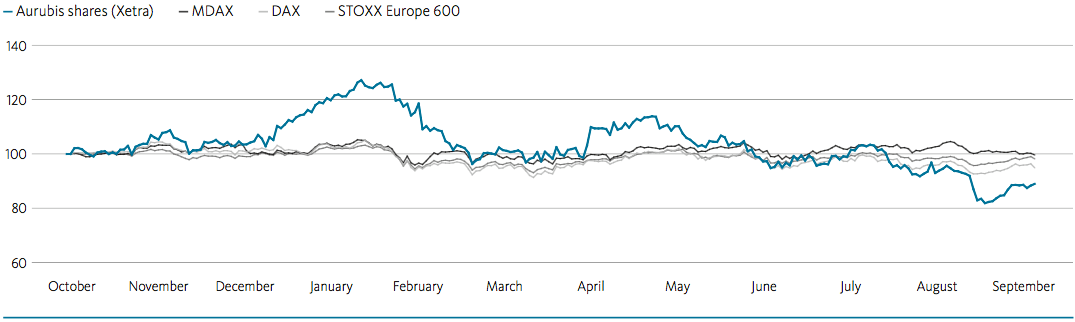
Aurubis shares record a volatile trend
The development of the Aurubis shares was very volatile during the fiscal year. After the new strategy was announced together with the release of the fiscal year 2016/17 results on December 13, 2017, the Aurubis shares took flight. Following the news on January 23, 2018 that Aurubis would acquire the Codelco shares in Deutsche Giessdraht GmbH, Emmerich, Aurubis shares reached a new all-time high of € 86.80 in the course of the day. The shares then lost ground in a volatile market environment in February despite very good quarterly results and were quoted at € 65.26 the day after the Annual General Meeting (March 2, 2018). The price recovered again to € 77.12 on May 11, 2018 after positive analyst assessments and the ad hoc announcement on April 26, 2018 regarding the forecast for fiscal year 2017/18, which was based on the very good half-year result. In the subsequent months, Aurubis shares were unable to avoid the general uncertainty on the capital markets resulting primarily from the conflicts between the US and its trading partners. Under the influence of share price adjustments by analysts following Capital Market Day in Bulgaria, the share price hit the year’s low of € 55.44 on September 11, 2018. In a more positive market environment, the shares recovered slightly to € 60.24 at the close of the fiscal year on September 28, 2018. However, their performance was –12 % for the fiscal year overall and trailed the similarly negative development of the DAX (–5 %), the MDAX (0 %), and the STOXX Europe 600 (–1 %). Market capitalization was € 2,708 million as at fiscal year-end (previous year: € 3,081 million).
Aurubis shares remain an attractive long-term investment. Shareholders who invested € 1,000 at the end of September 2008 and reinvested the dividends they received (without a tax deduction) into Aurubis shares had a portfolio value of € 2,753 on September 28, 2018. This is a 171 % increase in value or a total annual return of 10.05 %.
Trading volume of Aurubis shares exceed previous year
The volatility in the Aurubis share price was also evident in the daily average Xetra trading volume, which, at 217,736 shares, exceeded the prior-year level (200,869 shares).
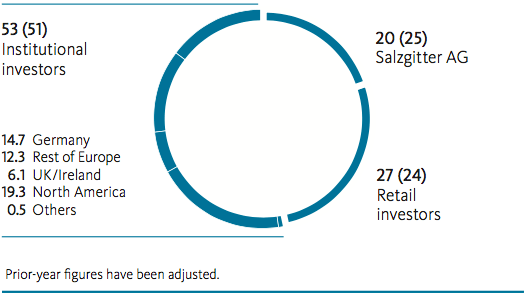
Aurubis has a well-diversified shareholder structure
Aurubis maintained its well-diversified shareholder structure in fiscal year 2017/18. An analysis carried out in September 2018 indicated that the proportion of institutional investors rose slightly to 53 % (previous year: 51 %). Increases were recorded in the rest of Europe (outside of Germany) and in North America in particular. The majority of institutional investors are located outside of Germany. The proportion of shares held by retail investors increased to 27 % (previous year: 24 %). In the course of repaying an exchangeable bond issued for Aurubis shares, Salzgitter AG reduced its shareholdings from 25.00 % to 15.75 % according to the voting rights notification on October 27, 2017. On April 11, 2018, Salzgitter AG announced that it had increased its shareholdings to 20 %.
Shareholder structure
in % (prior-year figures in parentheses)
Key figures of Aurubis shares
| 2017/18 2 | 2016/17 2 | 2015/16 2 | 2014/15 2 | 2013/14 2 | ||
| Closing price as at fiscal year-end 1 | in € | 60.24 | 68.54 | 49.88 | 56.90 | 39.16 |
| Year high (close) 1 | in € | 86.12 | 78.47 | 61.68 | 59.68 | 49.49 |
| Year low (close) 1 | in € | 55.44 | 46.79 | 37.54 | 36.43 | 36.19 |
| Market capitalization as at fiscal year-end 1 | in € million | 2,708 | 3,081 | 2,242 | 2,558 | 1,761 |
| Number of shares as at fiscal year-end | in thousand units |
44,956.7 | 44,956.7 | 44,956.7 | 44,956.7 | 44,956.7 |
| Dividend or recommended dividend | in € | 1.55 | 1.45 | 1.25 | 1.35 | 1.00 |
| Payout ratio 3 | in % | 26 | 28 | 34 | 24 | 45 |
| Dividend yield | in % | 2.6 | 2.1 | 2.5 | 2.4 | 2.6 |
| Operating earnings per share | in € | 5.87 | 5.21 | 3.64 | 5.68 | 2.17 |
| Operating price/earnings ratio as at fiscal year-end | 10.26 | 13.16 | 13.70 | 10.02 | 18.05 | |
| 1 Xetra disclosures. 2 Values have been “operationally” adjusted for measurement effects deriving from the use of the average cost method in accordance with IAS 2 and from copper price-related measurement effects on inventories, as well as from purchase price allocation impacts, primarily on property, plant, and equipment, commencing from fiscal year 2010/11 onwards. 3 In fiscal year 2016/17, the payout ratio definition was changed compared to the previous year. The new basis is the operating net result and no longer Aurubis AG’s unappropriated earnings. |
||||||
Executive Board and Supervisory Board suggest a dividend of € 1.55
The express objective of our dividend policy is to involve the shareholders in the company’s success adequately and consistently. The Executive Board and Supervisory Board will recommend a dividend of € 1.55 at the Annual General Meeting on February 28, 2019. This corresponds to a payout ratio of 26 % of the operating consolidated net income (previous year: 28 %). The dividend yield based on the closing price as at September 28, 2018 amounts to 2.6 % (previous year: 2.1 %).
Intensive dialogue with the capital markets
In fiscal year 2017/18, our new strategy, the volatile market environment, the varying developments on our sub-markets, and the company’s resulting earnings trend led to a high demand for information among capital market participants. We therefore intensified our proactive, timely, and targeted communication with retail and institutional investors and informed them via different channels about developments in the Aurubis Group’s business and potential. Dialogue with institutional investors took high priority again during the fiscal year. In addition to the business situation, the Executive Board and the Investor Relations department explained the new Aurubis Group strategy at many investor conferences and roadshows at the main financial centers in Europe and North America, in conference calls, and in a number of individual meetings. Webcasts on the release dates of our quarterly reports enabled investors and analysts to communicate with the Executive Board and management representatives. Moreover, many investors were informed about our processes, operating facilities, and products during visits to our Hamburg, Pirdop, and Olen sites.
In September 2018, analysts and institutional investors accepted our invitation to the Aurubis Capital Market Day at Aurubis Bulgaria in Pirdop. In expert presentations, discussions with the management, and a plant tour of one of Europe’s most state-of-the-art copper smelters, the participants received detailed information about the status of the strategy and the Aurubis Group’s future orientation, as well as a direct glimpse into our operating processes. Audio recordings and webcasts from Capital Market Day are available on our website.
We informed the capital markets about certain developments with ad hoc notifications. These comprised the announcement on February 12, 2018 about the signing of the term sheet with Wieland-Werke AG regarding the sale of Segment FRP and the announcement on April 26, 2018 about the increase in the forecast for the entire fiscal year.
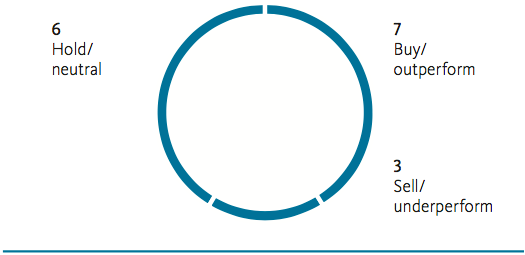
A total of 19 international financial analysts regularly published recommendations and analyses about Aurubis’ shares during fiscal year 2017/18. In the course of the fiscal year, coverage by Berenberg, Deutsche Bank and Credit Suisse was suspended due to changes in analysts. The ratings were as follows at the end of the fiscal year:
Overview of analyst recommendations
Number as at September 30,2018
Communicating with retail investors is another important focus of Investor Relations work. At an event in Hamburg, we gave a number of retail shareholders the opportunity to learn more about the Group’s current development and economic environment in discussions with the management and employees, as well as allowing them to see the production processes firsthand in a plant tour. We also held presentations for retail investors at events organized by private shareholder associations. Our Annual General Meeting on March 1, 2018, which for the first time was shown online in real time, had a good attendance level of 800 shareholders.
Current information on the development of the company is available at www.aurubis.com. We provide financial reports, analyst presentations, and additional publications in our download center.
| Security identification number | 676650 |
| International Securities ¬Identification Number (ISIN) | DE 000 67 66 504 |
| Stock market segment | MDAX |
| Stock exchanges | Regulated market: Frankfurt am Main and Hamburg; unofficial market: Berlin, Düsseldorf, Hanover, Munich, Stuttgart, Tradegate |
| Market segment | Prime Standard |
| Issue price | € 12.78 |
| Average daily trading volume | 217,736 shares in Xetra trading |
| Ticker symbol | NDA |
| Reuters code | NAFG |
| Bloomberg code | NDA_GR |
Analyst coverage 2017/18
| Baader Bank | Christian Obst |
| Bankhaus Lampe | Marc Gabriel |
| Bank of America/Merrill Lynch | Jason Fairclough |
| Berenberg 1 | |
| Commerzbank | Ingo-Martin Schachel |
| Credit Suisse 1 | |
| Deutsche Bank 1 | |
| DZ Bank | Dirk Schlamp |
| Exane BNP Paribas | Jatinder Goel |
| Goldman Sachs | Eugene King |
| Hauck & Aufhäuser | Henning Breiter |
| Independent Research GmbH | Sven Diermeier |
| Kepler Cheuvreux | Rochus Brauneiser |
| LBBW | Jens Münstermann |
| Macquarie Research | Ioannis Masvoulas |
| Morgan Stanley | Menno Sanderse |
| NordLB | Holger Fechner |
| Quirin Bank AG | Klaus Soer |
| M.M. Warburg | Eggert Kuls |
| 1 Coverage currently suspended due to a change in analyst | |